
Implied Probability in Football Betting: Converting Odds to Percentages
 Available in US
Betting odds are just probability in disguise. Every price a bookmaker offers on a football match encodes their assessment of how likely that outcome is to happen. Learning to convert odds into probabilities — and back again — transforms how you think about betting. Instead of seeing cryptic numbers, you start seeing statements about the world: the bookmaker believes Liverpool have a 62% chance of winning, or that there’s a 28% chance both teams will score. Once you speak this language fluently, comparing odds across bookmakers, identifying value, and making rational decisions becomes dramatically easier.
Implied probability is simply the probability of an outcome as suggested by the betting odds. The word “implied” is important — it’s not necessarily the true probability, just what the odds imply. Bookmakers build margin into their prices, so implied probabilities from betting odds always sum to more than 100% across all outcomes in a market. Understanding this distinction between implied probability and true probability is fundamental to finding betting value.
The Core Conversion: Decimal Odds to Probability
Decimal odds make the conversion trivially simple. To find implied probability from decimal odds, divide 1 by the odds and multiply by 100 to express as a percentage.
Implied Probability (%) = (1 / Decimal Odds) × 100
At odds of 2.00, the implied probability is (1 / 2.00) × 100 = 50%. The bookmaker is pricing this outcome as a coin flip. At odds of 4.00, the implied probability is 25% — roughly one chance in four. At odds of 1.50, it’s 66.7% — about two chances in three.
This relationship is intuitive once you grasp it. Higher odds mean lower probability; lower odds mean higher probability. Odds of 1.10 imply 90.9% probability — a near certainty in the bookmaker’s view. Odds of 10.00 imply just 10% probability — a genuine longshot. The mental shortcut is that “even money” (2.00) equals 50%, and everything else scales from there.
Working backwards — converting probability to odds — is equally simple: divide 100 by the probability percentage. If you believe an outcome has a 40% chance of occurring, fair odds would be 100 / 40 = 2.50. If a bookmaker offers better than 2.50, you’ve potentially found value. If they offer worse, you’re being asked to accept unfair odds.
The ability to move fluidly between odds and probability reframes every betting decision. Instead of wondering whether odds of 3.25 “feel” right for a particular outcome, you can ask whether a 30.8% implied probability matches your assessment of reality. That’s a question you can actually answer with analysis.
Converting Fractional Odds
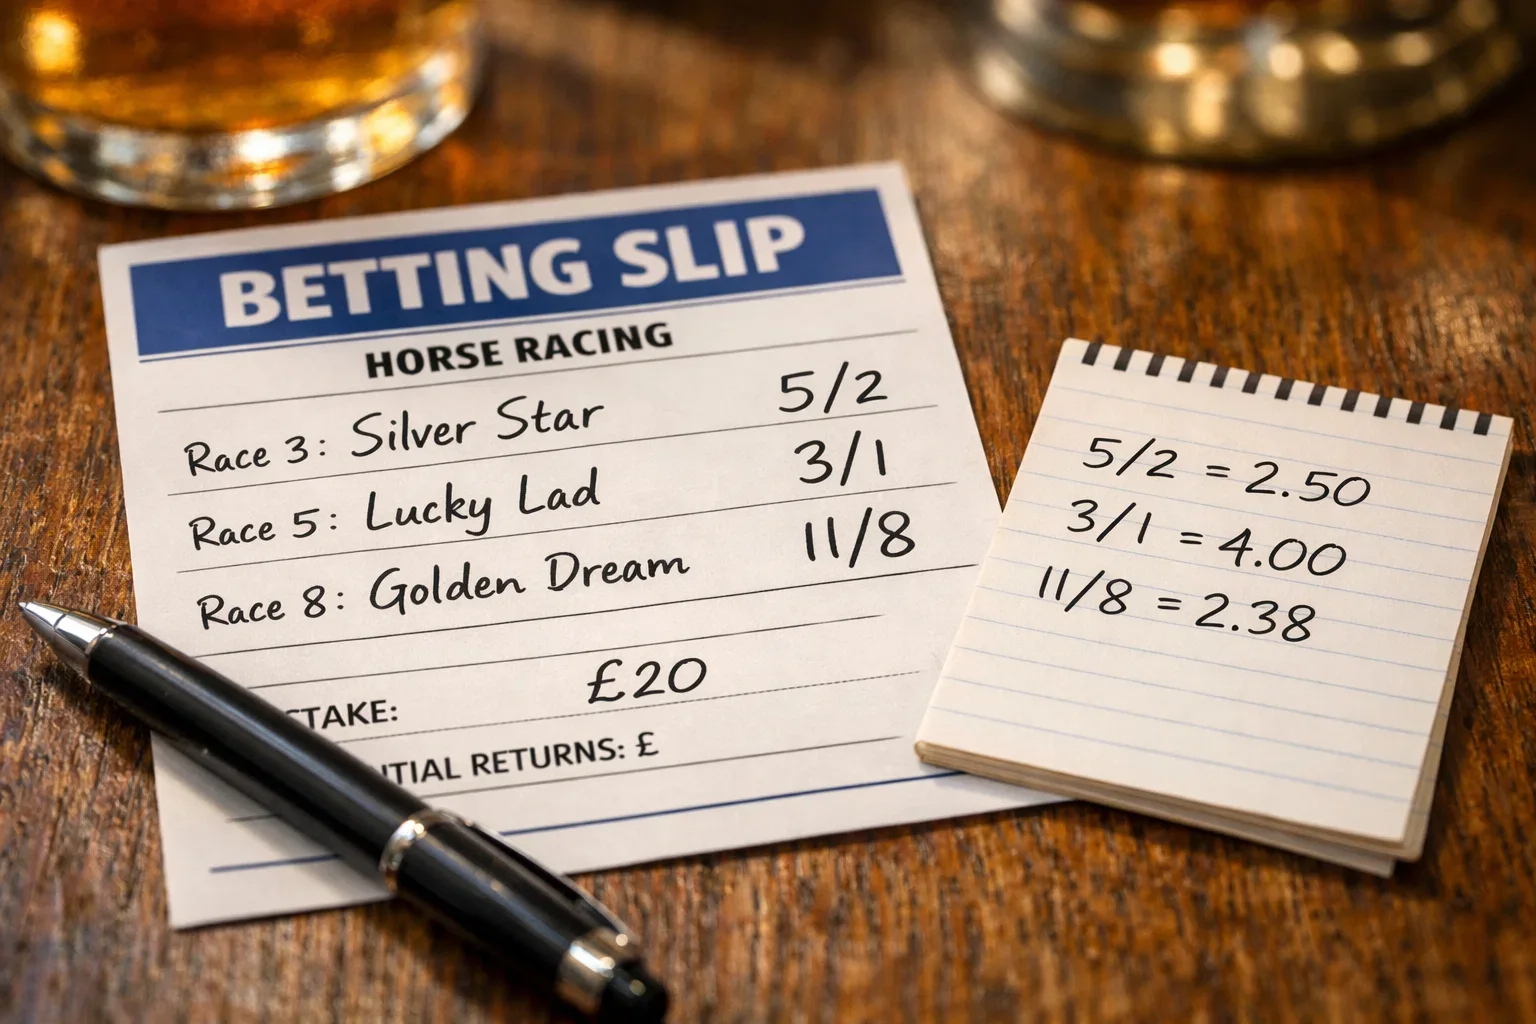
Fractional odds require a slightly different formula, but the logic is the same. For fractional odds expressed as A/B (like 5/2 or 1/3), the implied probability formula is:
Implied Probability (%) = B / (A + B) × 100
At odds of 5/2, the implied probability is 2 / (5 + 2) × 100 = 28.6%. At odds of 1/4, it’s 4 / (1 + 4) × 100 = 80%. At evens (1/1), it’s 1 / (1 + 1) × 100 = 50%.
The intuition here is that the denominator (B) represents how often you win in a theoretical long-run scenario, while the sum (A + B) represents all possible outcomes. If the odds are 3/1, you’re expected to win once every four attempts (1 in 4 = 25%). If the odds are 1/2, you’re expected to win twice every three attempts (2 in 3 = 66.7%).
To convert probability back to fractional odds, first convert to decimal using (100 / probability), then subtract 1 to get the fractional numerator over 1. A 25% probability equals decimal odds of 4.00, which is 3/1 fractional. A 60% probability equals decimal 1.67, which is approximately 2/3 fractional. Clean fractions don’t always emerge, which is why decimals are more precise.
Fractional odds can also be expressed in their non-reduced forms — 6/4 instead of 3/2, for instance — but the probability calculation works identically. Both 6/4 and 3/2 imply the same 40% probability, just expressed differently.
Converting American Odds
American odds use positive and negative numbers, requiring separate formulas depending on the sign. For positive odds (underdogs), the formula is:
Implied Probability (%) = 100 / (American Odds + 100)
At +200 odds, implied probability is 100 / (200 + 100) = 33.3%. At +150, it’s 100 / 250 = 40%. At +400, it’s 100 / 500 = 20%.
For negative odds (favourites), the formula changes:
Implied Probability (%) = |American Odds| / (|American Odds| + 100) × 100
The vertical bars mean “absolute value” — use the number without the minus sign. At -150 odds, implied probability is 150 / (150 + 100) × 100 = 60%. At -200, it’s 200 / 300 × 100 = 66.7%. At -300, it’s 300 / 400 × 100 = 75%.
The split between positive and negative creates a natural dividing line at 50%. Positive odds always imply less than 50% probability (underdogs); negative odds always imply more than 50% probability (favourites). Even money in American odds is +100 or -100, both implying exactly 50%.
Converting probability to American odds also requires knowing which side of 50% you’re on. For probabilities under 50%, use: American Odds = (100 / probability) – 100, then express as positive. For probabilities over 50%, use: American Odds = probability / (1 – probability) × (-1), then express as negative. A 30% probability converts to +233. A 70% probability converts to -233.
Why Implied Probabilities Exceed 100%
If you add up the implied probabilities of all outcomes in a betting market, you’ll consistently get a number above 100%. This isn’t a mistake — it’s the bookmaker’s margin at work.
Consider a football match with three possible 1X2 outcomes. The bookmaker offers Home 2.10, Draw 3.40, Away 3.80. Converting each to implied probability: Home = 47.6%, Draw = 29.4%, Away = 26.3%. The total is 47.6 + 29.4 + 26.3 = 103.3%.
That extra 3.3% above 100% is the overround — the bookmaker’s built-in profit margin. They’re pricing every outcome slightly shorter than fair value, ensuring they profit regardless of which outcome occurs. A market summing to 103% means the bookmaker expects to keep roughly 3% of all money wagered (the precise calculation involves dividing by the total, but 3% is the intuitive approximation).
The overround varies by bookmaker, market type, and event popularity. Sharp bookmakers on major leagues might operate at 102-103%. Recreational bookmakers or exotic markets might reach 108-110% or higher. The lower the overround, the better the value for bettors — you’re giving away less margin to the house.
Understanding overround explains why comparing odds across bookmakers matters. If one site offers 103% total market and another offers 107%, betting at the first site is mathematically superior before even considering which outcome you’re backing.
Removing the Margin: Calculating True Probability
The implied probabilities from betting odds include the bookmaker’s margin. To estimate “true” probabilities — what fair odds would look like — you need to remove this margin.
The simplest method is proportional normalisation. Calculate implied probabilities for all outcomes, sum them to find the overround, then divide each implied probability by this sum.
Using our earlier example with 103.3% total overround: True Home probability = 47.6% / 1.033 = 46.1%, True Draw probability = 29.4% / 1.033 = 28.5%, True Away probability = 26.3% / 1.033 = 25.5%. These now sum to exactly 100%.
To convert these true probabilities back to fair odds, use the inverse: Fair Home odds = 100 / 46.1 = 2.17, Fair Draw odds = 100 / 28.5 = 3.51, Fair Away odds = 100 / 25.5 = 3.92.
Comparing these fair odds to what bookmakers actually offer reveals where value might exist. If a bookmaker offers 2.25 on the home win when fair value is 2.17, they’re offering below-fair odds — poor value. If they offer 4.00 on the away win when fair value is 3.92, they’re offering above-fair odds — potential value if your own probability assessment agrees.
This proportional method assumes the bookmaker applies margin evenly across all outcomes, which isn’t perfectly accurate. Research shows bookmakers typically shade longshots more heavily than favourites — the favourite-longshot bias. More sophisticated margin removal techniques account for this, but the proportional method provides a useful starting point.
Using Implied Probability to Find Value
The practical application of all this mathematics is identifying value bets — situations where the bookmaker’s implied probability is lower than your estimated true probability.
Suppose you analyse a match between Wolves and Crystal Palace. After considering form, injuries, home advantage, and head-to-head records, you estimate Wolves have a 45% chance of winning. The bookmaker offers Wolves at 2.50, implying (1 / 2.50) × 100 = 40% probability.
Your 45% assessment exceeds the bookmaker’s 40% implied probability by 5 percentage points. This suggests value on Wolves — you’re getting odds that imply a worse chance than you believe exists. Over many such bets, if your probability assessments are accurate, this edge compounds into profit.
The comparison works equally well in reverse. If the bookmaker implies 40% and you only estimate 35%, the bet has negative value — you’d be accepting odds worse than fair given your beliefs. Pass on these bets, regardless of how appealing the match or price seems.
This framework applies universally across markets. Implied probability on over 2.5 goals is 55% based on the odds; you estimate 62% based on attacking strengths and defensive weaknesses — potential value on overs. Implied probability on BTTS Yes is 48%; you estimate 44% based on clean sheet records — no value, possibly value on BTTS No. Every bet decision becomes a comparison between your probability and the implied probability.
Common Probability Benchmarks to Memorise
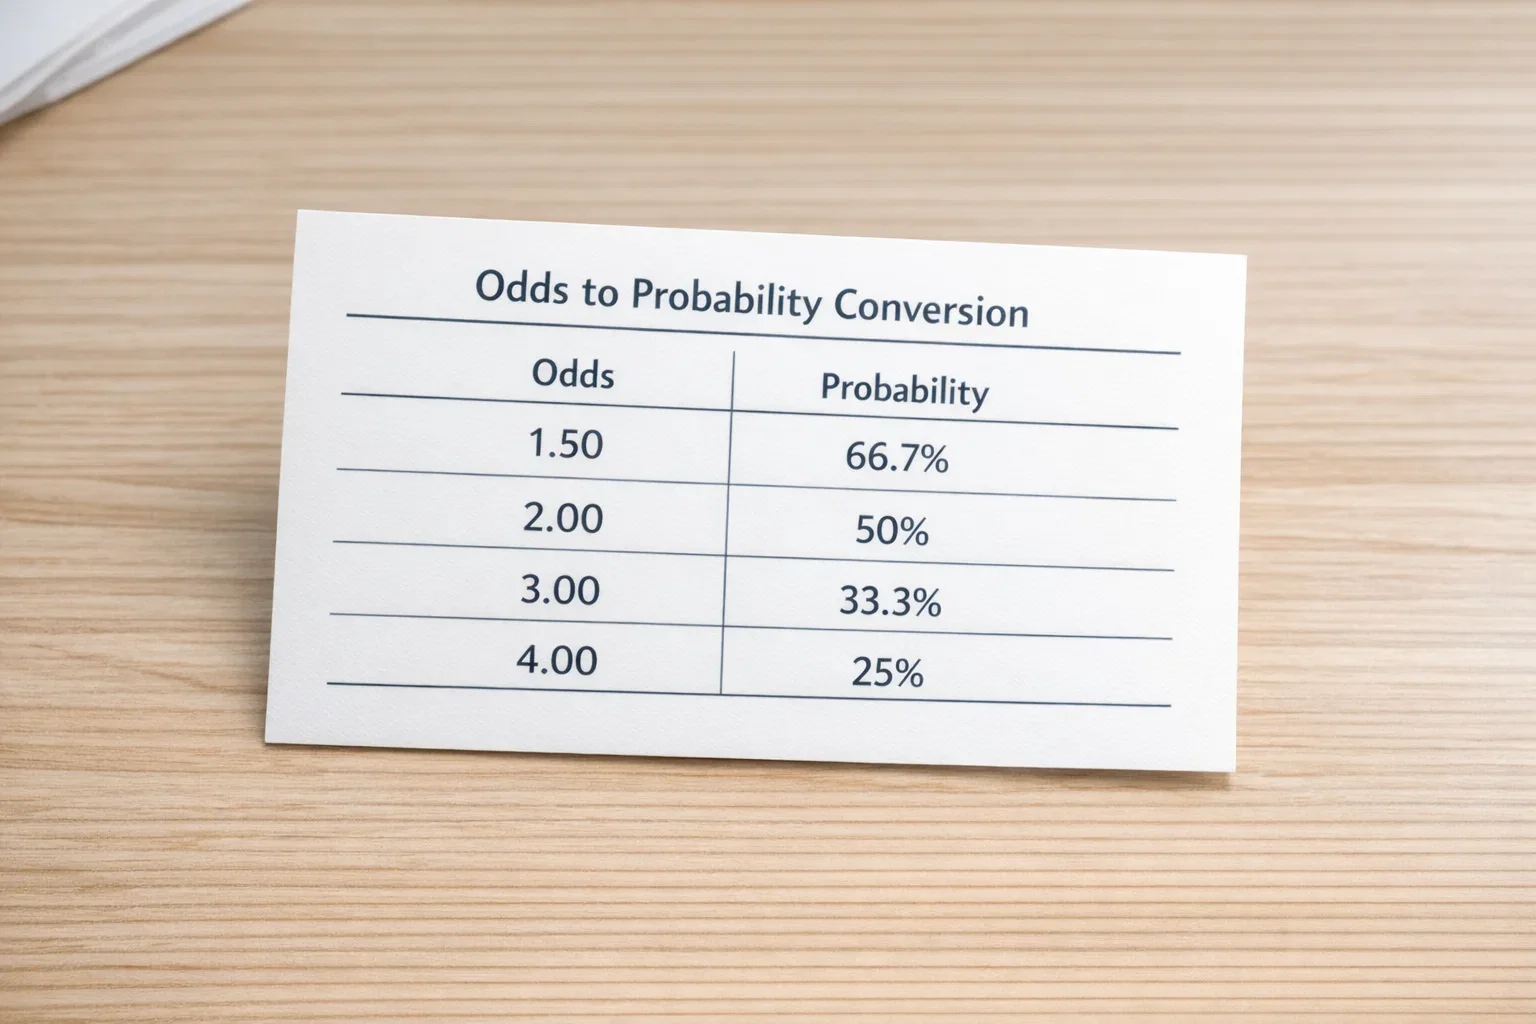
While calculators and mental math work fine, memorising common odds-probability pairs accelerates your thinking at the betting interface.
- 1.20 decimal = 83.3% = about 1 in 6 times it fails
- 1.50 decimal = 66.7% = about 2 in 3 chance
- 2.00 decimal = 50.0% = coin flip
- 2.50 decimal = 40.0% = about 2 in 5 chance
- 3.00 decimal = 33.3% = about 1 in 3 chance
- 4.00 decimal = 25.0% = about 1 in 4 chance
- 5.00 decimal = 20.0% = about 1 in 5 chance
- 10.00 decimal = 10.0% = about 1 in 10 chance
- 20.00 decimal = 5.0% = about 1 in 20 chance
These benchmarks let you quickly assess any odds. Something at 3.50? That’s between 3.00 (33%) and 4.00 (25%), so roughly 28-29%. Something at 1.80? Between 1.50 (67%) and 2.00 (50%), so roughly 55-56%. Close enough for rapid evaluation.
When you see odds and immediately think in probability terms, you’re asking better questions. “Is a 28% chance about right for this away win?” is more useful than “Do 3.50 odds feel correct?” The first question connects to football knowledge; the second is just guessing at numbers.
Practical Workflow: From Odds to Decision
Here’s how implied probability fits into a betting decision workflow.
First, identify the odds on your potential bet and convert to implied probability. If Arsenal are 1.70 to beat Brighton, that implies 58.8% probability. The bookmaker believes Arsenal win about three times in five.
Second, form your own probability assessment. Based on your analysis — team form, injuries, tactical matchups, home advantage, motivation — what percentage chance do you give Arsenal? Maybe you estimate 65%. Maybe you estimate 55%. The key is having an explicit number, not a vague sense of confidence.
Third, compare the probabilities. If your estimate exceeds the implied probability (65% vs 58.8%), you’ve identified potential value. If it’s lower (55% vs 58.8%), the bet offers poor value — pass. If they’re very close, the bet is roughly fair but margin still works against you, so generally pass unless you have strong conviction.
Fourth, consider the margin. Even if your probability exceeds the implied probability, your edge needs to exceed the bookmaker’s margin to profit long-term. If the market has 5% overround and your edge is only 3%, you’re still losing money on average. Sharp bettors target situations where their edge clearly exceeds the margin.
Fifth, size your bet appropriately. If you’ve found genuine value, stake according to your bankroll management system — flat units, percentage staking, or Kelly-based approaches. Higher edge situations might merit larger stakes, but never bet more than you can afford to lose.
This workflow transforms betting from gambling into analysis. You’re not hoping Arsenal win because you support them or because someone on social media said so. You’re making a calculated decision based on probability comparison, accepting that individual bets will lose but expecting aggregate profit from correct probability assessments over time.
Implied probability isn’t magic — it doesn’t tell you who will win. But it clarifies what you’re being asked to believe when you accept certain odds, and it provides the framework for deciding whether that belief matches reality. Master this conversion, and you’ll never look at betting odds the same way again.
