
Correct Score Betting in Football: High Risk, High Reward Strategy
 Available in US
Correct score betting is the sharpshooter’s market — predicting the exact final scoreline of a football match rather than simply which team wins or how many goals are scored. Getting it right pays handsomely, with even common scorelines like 1-0 or 2-1 typically offering odds of 6.00-9.00. Rarer results like 4-3 or 5-2 can return 50.00 or higher. The appeal is obvious: a relatively small stake can produce substantial returns if your prediction hits. The challenge is equally obvious: you’re picking one outcome from dozens of possibilities, and the probability of any specific scoreline is inherently low.
Most recreational bettors treat correct score betting as glorified lottery tickets — pick a score that feels right and hope. This approach is mathematically doomed. The bookmaker’s margin on correct score markets typically exceeds 20%, sometimes reaching 30%+, far higher than the 3-5% on standard match betting. To profit long-term, you need either exceptional edge in predicting scorelines or a systematic approach to identifying when the market misprices specific outcomes. Neither is easy, but both are possible with the right analytical framework.
Why Correct Score Markets Have Huge Margins
Bookmakers charge higher margins on correct score markets for several interconnected reasons. First, the market has many outcomes — typically 15-20 commonly priced scorelines from 0-0 to 4-3, plus catch-all “any other” options. More outcomes mean more opportunities for the bookmaker to shade each price slightly without bettors noticing. The overround accumulates across dozens of selections rather than just three.
Second, correct score attracts recreational money disproportionately. Casual bettors love the big payouts and often bet scorelines based on superstition, lucky numbers, or dramatic narratives rather than analysis. Bookmakers know this soft money will flow regardless of margin, so they extract maximum profit. Sharper bettors mostly avoid the market, leaving prices less efficiently arbitraged than in head-to-head or goals markets.
Third, variance protection. Even with inflated margins, bookmakers face significant liability risk on correct score bets. A popular scoreline that hits could produce substantial payouts. Higher margins buffer against these outcomes, ensuring profitability even when unlikely results occur.
Fourth, the difficulty of accurate pricing. Predicting exact scorelines requires more precision than predicting winners or goal totals. Bookmakers themselves have less confidence in their correct score odds, so they build in additional margin as uncertainty compensation.
Understanding these dynamics explains why finding value in correct score markets is difficult but not impossible. You’re fighting against structural disadvantages — but those disadvantages also mean the market is less efficiently priced than simpler alternatives.
Using Poisson Distribution for Score Prediction
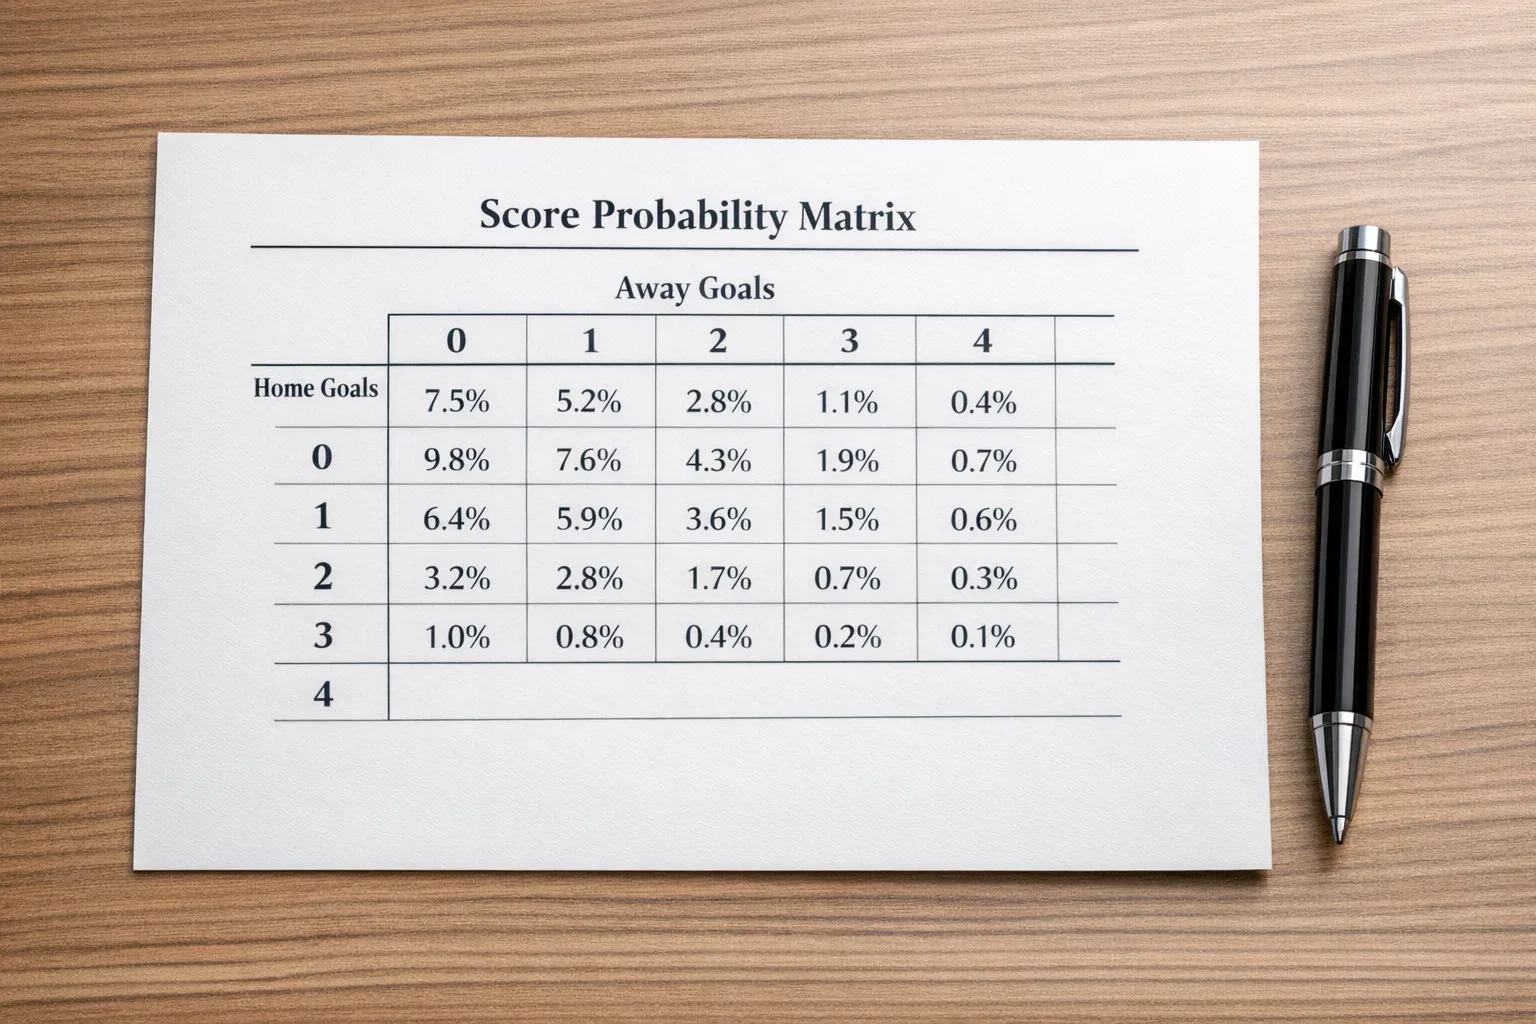
The Poisson distribution is a mathematical formula that calculates the probability of a specific number of events occurring in a fixed interval, given a known average rate. For football betting, the “events” are goals, and the “interval” is 90 minutes. Poisson models have been used to predict football scores since the 1980s and remain the foundation of most quantitative approaches to correct score betting.
The core idea is simple: estimate how many goals each team is expected to score, then use Poisson to calculate the probability of every possible goal count. Combining these probabilities produces a full matrix of scoreline probabilities.
Step 1: Calculate expected goals for each team. The standard approach uses attacking and defensive strength ratings derived from historical data. Calculate each team’s attacking strength (goals scored relative to league average) and defensive strength (goals conceded relative to league average). Multiply the home team’s attacking strength by the away team’s defensive weakness and the league average home goals to get expected home goals. Repeat for the away team.
For example, if Manchester City average 2.5 goals per home game in a league where the average is 1.5, their home attacking strength is 2.5/1.5 = 1.67. If Everton concede 1.6 goals per away game against an average of 1.3, their defensive weakness is 1.6/1.3 = 1.23. City’s expected goals = 1.67 × 1.23 × 1.5 (league average) = 3.08 expected goals.
Step 2: Apply Poisson formula to each goal count. The formula is P(k) = (λ^k × e^-λ) / k!, where λ is expected goals, k is the specific goal count, and e is Euler’s constant (2.718). For City with 3.08 expected goals, the probability of scoring exactly 2 goals is (3.08^2 × e^-3.08) / 2! = (9.49 × 0.046) / 2 = 21.8%.
Step 3: Build the scoreline probability matrix. Calculate goal probabilities for each team across 0-5 goals (or higher if needed). Then multiply corresponding probabilities to find each scoreline’s likelihood. If City scoring 2 is 21.8% and Everton scoring 1 is 27.3%, then the 2-1 scoreline probability is 21.8% × 27.3% = 5.95%.
Step 4: Compare model probabilities to bookmaker odds. Convert your Poisson probabilities to implied odds (100 / probability). If your model says 2-1 has 5.95% probability, fair odds are 16.8. If the bookmaker offers 9.00, the market significantly underprices this scoreline — no value. If they offer 20.00, you’ve found potential value.
Limitations of Poisson Models
While Poisson distribution provides a useful framework, it has well-documented limitations that affect correct score prediction accuracy.
Poisson underestimates draws, especially 0-0. The mathematical structure of Poisson treats each team’s scoring as independent, but real football has tactical dynamics that create more goalless draws than the model predicts. Teams protecting leads reduce attacking intent; teams unable to break deadlocks sometimes accept 0-0 rather than risking counterattacks. Most analysts apply “zero-inflation” adjustments, manually increasing 0-0 probability by 10-20% above raw Poisson output.
Poisson underestimates high-scoring games. Matches can become chaotic when one team chases the game, leading to scores like 4-3 or 5-4 more often than Poisson’s independent goal assumptions suggest. Once a game opens up, goals often cluster rather than occurring at steady average rates.
Historical data may not reflect current ability. Poisson models typically use season-long or multi-year averages, but team strength changes through injuries, transfers, managerial changes, and form fluctuations. A model based on last season’s data may not capture current reality.
Home advantage varies significantly. Standard models apply uniform home advantage, but some teams have much stronger home factors than others. Adjusting for team-specific home advantage improves accuracy.
Match context affects outcomes. Poisson treats every match identically, but cup finals, relegation battles, and dead rubbers have different scoring patterns than routine league games. The model cannot capture motivational or tactical factors beyond what’s reflected in historical scoring rates.
Despite these limitations, Poisson provides a rigorous baseline for evaluating correct score probabilities. Refining the model to address these weaknesses — or simply being aware of when limitations might distort predictions — improves its practical application.
Common Scoreline Probabilities
Understanding the typical distribution of football scorelines helps calibrate expectations for correct score betting.
In most top European leagues, the most common scorelines and their approximate frequencies are: 1-1 (around 11-12%), 1-0 (10-11%), 2-1 (9-10%), 0-0 (7-9%), 2-0 (8-9%), 0-1 (7-8%), 2-2 (4-5%), 3-1 (4-5%), 1-2 (4-5%), 3-0 (3-4%). These ten scorelines typically account for about 70-75% of all match outcomes.
Scorelines beyond 3-3 combined represent only 5-10% of matches. Individual high-scoring results like 4-3, 5-2, or 4-4 each occur in less than 1% of games. This rarity explains their long odds — but also means betting them requires accepting very low hit rates.
The home team wins approximately 45% of matches, draws occur 25-27%, and away wins happen 28-30%. When pricing correct scores, roughly 45% of probability should be assigned to home win scorelines, 25% to draws, and 30% to away wins — though this varies based on the specific matchup.
When Correct Score Betting Offers Value
Despite the high margins, certain situations create value opportunities in correct score markets.
Extreme mismatches sometimes produce mispriced scorelines. When Manchester City faces a weak cup opponent, the market expects heavy winning margins. But bookmakers may underprice specific scorelines like 5-0 or 6-0 because they’re uncertain exactly which high-scoring result will occur. If your model strongly favours 5-0 based on City’s typical scoring patterns against weak opponents, you might find value even in an inflated market.
Matches with strong draw tendencies often see 0-0 and 1-1 underpriced. Two defensive teams meeting in a low-stakes midseason fixture may have 20% combined draw probability, with 0-0 alone perhaps 10%. If the market prices 0-0 at 12.00 (8.3% implied), you’ve found value.
Unusual circumstances create inefficiencies. Matches with red cards, extreme weather, or unusual team news may not be repriced quickly in correct score markets. Bookmakers focus attention on head-to-head and goals markets; correct score updates may lag, creating brief value windows.
Covering multiple scorelines reduces variance while maintaining value. Rather than backing a single scoreline, spread stakes across several related outcomes — say, 1-0, 2-0, and 2-1 for a home win. This approach accepts lower individual odds but improves hit rate. If your model suggests 25% combined probability for these three scorelines at average odds of 8.00, you’re getting reasonable value with more manageable variance.
Late-game live betting occasionally offers value when in-play correct score markets don’t adjust quickly enough to match state. If it’s 1-1 in the 85th minute and the market still offers long odds on 1-1, you’re backing the likely outcome at inflated prices.
Building a Correct Score Betting Approach
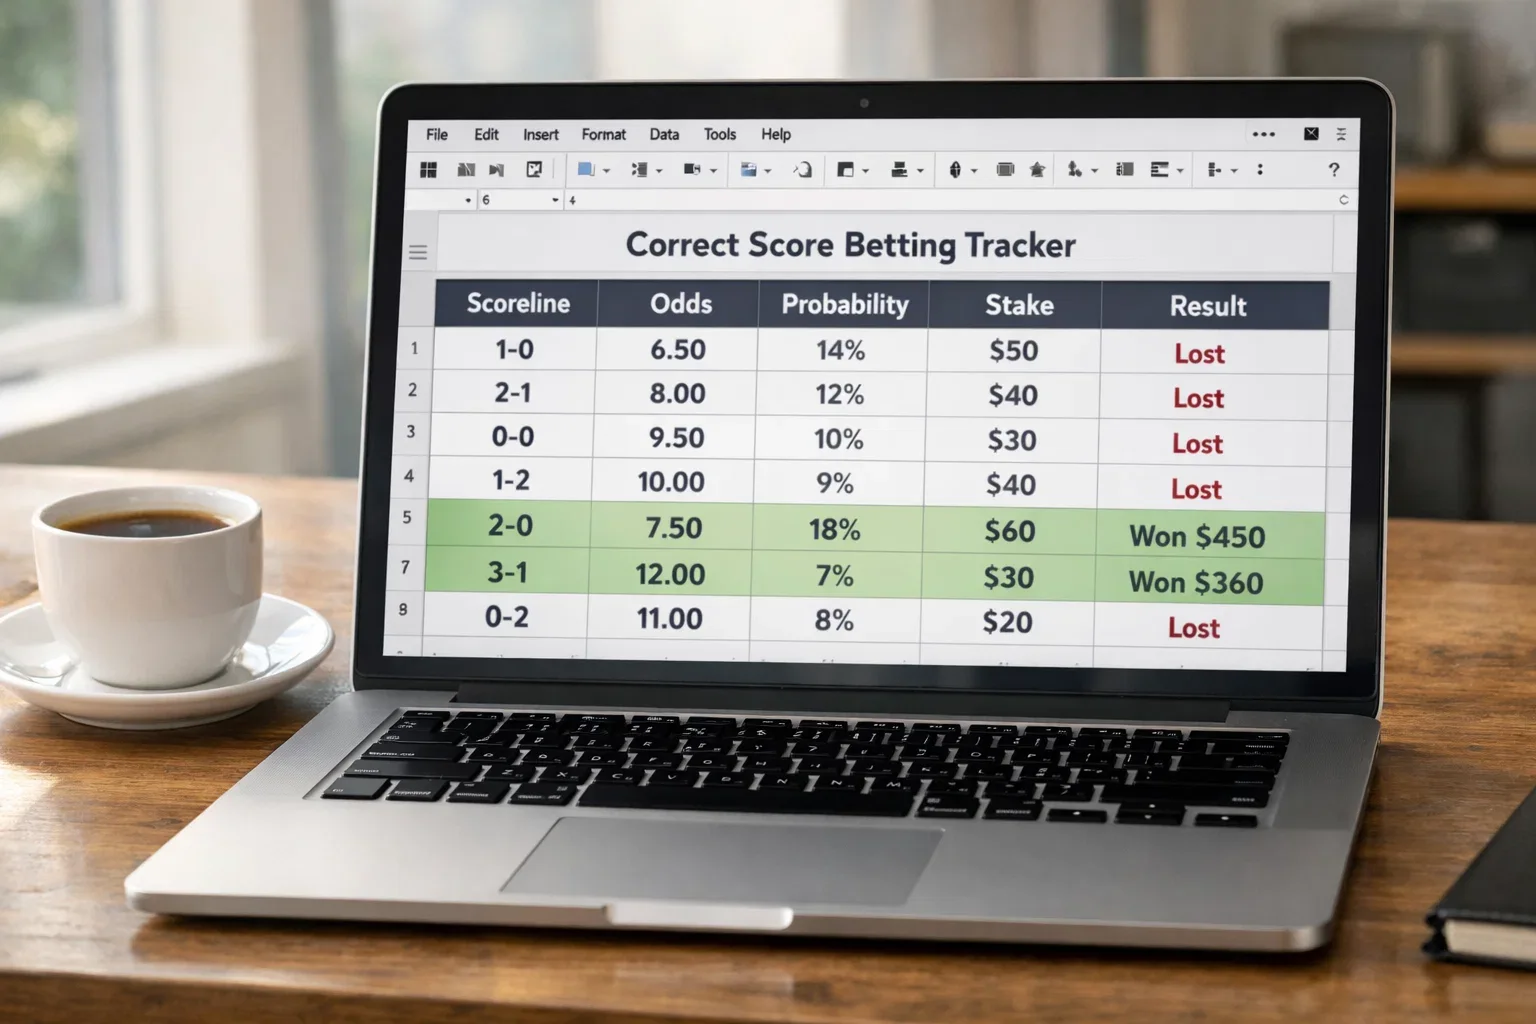
Profitable correct score betting requires systematic methodology rather than occasional punts on attractive odds.
Develop or adopt a Poisson model. Spreadsheets with Poisson calculations are freely available online, or you can build your own in Excel using the POISSON.DIST function. Input expected goals for each team to generate a complete scoreline probability matrix. Compare these probabilities to bookmaker odds across all scorelines to identify potential value.
Apply adjustments for known Poisson weaknesses. Manually inflate 0-0 probability by 10-15%. Slightly increase probabilities for home wins in matches with strong home advantage. Reduce predicted goal totals for cup finals, derbies, and other typically tight encounters. These adjustments improve model calibration with real-world patterns.
Focus on scorelines where you have edge, not just high odds. A 50.00 price on 4-4 is irrelevant if your model suggests 0.8% probability (fair odds 125.00). The value scorelines are often boring ones — 1-0, 1-1, 2-1 — where your model sees 10-12% probability but the market offers 8.00-9.00 (11-12.5% implied). Small edges on higher-probability scorelines produce better long-term returns than lottery tickets on unlikely results.
Track results rigorously. Record every correct score bet: the scoreline backed, odds taken, model probability, and result. Over hundreds of bets, you’ll see whether your model generates genuine edge or whether you’re simply losing to the margin. Without tracking, you cannot distinguish skill from luck.
Accept high variance. Even the best correct score bettors experience long losing runs. If your model identifies 10% edges, you’re still losing 90%+ of individual bets. Bankroll management must account for this — small stakes relative to bankroll, or spreading stakes across multiple scorelines per match.
Alternatives to Direct Correct Score Betting
If direct correct score betting’s margins seem prohibitively high, consider adjacent markets that capture similar edges with lower bookmaker advantage.
Scoreline range betting lets you back groups of scorelines (1-0 or 2-0, any draw, home win by exactly one goal). These markets have lower margins than individual scorelines while allowing you to express views on narrow result ranges.
Exact goals betting (match to have exactly 2 goals, exactly 3 goals) uses similar analysis to correct score but with fewer outcomes and tighter margins. If your Poisson model suggests 25% probability of exactly 2 goals across all scorelines, you can bet this directly without specifying which team scores what.
Halftime/fulltime betting rewards predictions about match flow rather than exact final score. If you expect a team to win comfortably after a tight first half, HT/FT of Draw/Home at 5.00 might offer better value than picking the exact 2-1 final scoreline.
Asian handicaps and goal lines let you express correct-score-adjacent views with much tighter margins. If your analysis suggests 2-1 is the most likely scoreline, backing the favourite at -1.0 Asian handicap (which wins if they win by exactly one) captures similar logic with 2-3% margin rather than 25%.
Correct score betting rewards those who approach it analytically rather than emotionally. The high payouts are real, but so are the high margins and low hit rates. Success requires model-driven probability assessment, disciplined value identification, and acceptance that most bets will lose. For bettors with the analytical tools and psychological resilience to handle this variance, the market offers genuine opportunities — but it’s far from the easy money that casual punters imagine.
